
The Problem: Colour Grades, Not V Grades
If you've ever climbed at The Climbing Hangar, you'll know it doesn't follow the conventional V-grade bouldering system. Instead of V0, V1, V2 and so on, problems are graded by colour — Grey, Green, Orange, Blue, Purple, Pink, Red, Yellow, White, and Black. It's a clean, accessible system that works brilliantly on the wall, but it creates a gap when it comes to tracking your progress digitally.
Most climbing tracking apps are built around V grades or Font grades. They don't know what a "Grey" or a "Purple" means. So if you want to record your sessions at The Climbing Hangar in any meaningful way, you're either manually logging it in a notebook or shoe-horning it into a system that doesn't quite fit.
I climb at The Climbing Hangar regularly and wanted a better way to track my sessions — straight from my wrist, without faffing with a phone mid-session. So I built one (with Claude).
Before I go in to the details though, I have to mention my thought process - I was going to use Garmin's API but you can only get access to that if you are a company, not a "hobby" developer. Which is a shame. The next thought was to push my data to Strava and then use Strava's API but I've just come off Strava so this felt a backwards step.
I was rubber ducking this idea with some friends online and Nik Rimington came up with the idea of building my own app for my watch and the just pushing the data to my own custom endpoints. Cheers Nik, that's exactly what I ended up doing.
The Solution: A Garmin Connect IQ Watch App
I wrote (with Claude) a native app for Garmin watches using Monkey C, the programming language used to build Garmin Connect IQ applications.
What the App Does
The app runs directly on the watch. During a session, I can log each individual boulder problem I attempt:
Grade - selected from the 10 Climbing Hangar colours (Grey through to Black)
Outcome - either Completed or Attempted (failed)
Duration - how long I spent on that problem in seconds
At the end of a session, the app automatically calculates:
Total number of problems attempted
Total number completed
Total session duration
A breakdown of every individual problem logged
When the session is finished, the watch sends a POST request to an API endpoint with all of the session data as a JSON payload. The watch identifies itself using a device ID derived from the hardware, and the request is authenticated with an API key passed in the X-Api-Key header.
The JSON Payload
Each session is sent to the API in this structure:
{
  "deviceId": "f00e1e824e6a7707fb521175ec4ddfac4e843c8a",
  "sessionDate": 1739812515,
  "totalDurationSec": 3600,
  "totalProblems": 12,
  "completed": 8,
  "attempted": 4,
  "problems": [
    { "grade": "Grey",   "outcome": "Completed", "durationSec": 120 },
    { "grade": "Green",  "outcome": "Completed", "durationSec": 240 },
    { "grade": "Orange", "outcome": "Attempted", "durationSec": 480 },
    { "grade": "Blue",   "outcome": "Completed", "durationSec": 300 }
  ]
}
The session date is sent as a Unix epoch timestamp from the watch, which is then converted server-side to a DateTime.
Storing the Data in Umbraco
Rather than setting up a separate database or API service, I used Umbraco 17 (running on .NET 10) as both the CMS and the data store. My site is already running Umbraco, so it made sense to keep everything in one place.
Content Model
I created a custom content structure specifically for bouldering data:
Boulder Problem — an Element Type (not a full document) with three properties:
grade — TextBox
outcome — TextBox
durationSec — Integer
Bouldering Session — a Document Type with:
deviceId — TextBox
sessionDate — DateTime
totalDurationSec — Integer
totalProblems — Integer
completed — Integer
attempted — Integer
problems — Block List using the Boulder Problem element type
Bouldering Sessions — a container Document Type that holds all session nodes as children.
Each time the Garmin watch sends a POST request, a new Bouldering Session node is created programmatically under the container using IContentService, with each individual problem stored as a block in the Block List property. The content is then saved and published so it's immediately available via the published content cache.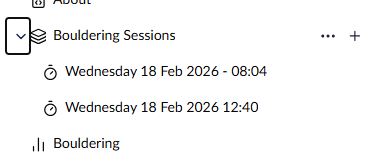
The API Endpoint
The endpoint lives at /umbraco/api/bouldering/postsession and is built as a standard API controller. It:
Validates the X-Api-Key header against a value stored in appsettings.json
Deserialises the JSON payload
Converts the Unix timestamp to a DateTime
Builds the Block List JSON structure manually to match Umbraco's internal format
Creates and publishes the content node
The Bouldering Dashboard
Once the data is in Umbraco, it's surfaced through a custom frontend dashboard at /bouldering. This is built as a standard Umbraco Razor view using a custom RenderController and a view model populated by a BoulderingDashboardService.
What the Dashboard Shows
Sessions View — a card-based grid of all recorded sessions, showing date, total problems, completed count, and a visual completion rate bar. Clicking a session opens the detail view.
Session Detail View — a deep-dive into a single session showing:
Every individual problem logged, with grade colour indicator, outcome badge, and duration
A Statistics by Grade table breaking down climbs per colour — total attempts, completions, failures, success rate percentage, and total time spent on each grade
A doughnut chart showing the grade distribution for that session
Weekly / Monthly / Yearly Views — aggregated statistics grouped by time period, showing session counts, average problems per session, success rates, and average session duration.
Overall Stats — always visible at the top of the dashboard: total sessions, total problems, overall completion rate, and total time on the wall.
Charts
Visualisations are powered by Chart.js (v4.4.1), loaded via CDN. Charts include:
Grade Distribution Doughnut — coloured segments matching The Climbing Hangar's grade colours (Grey, Green, Orange, Blue, Purple, Pink, Red, Yellow, White, Black)
Completion Rate Trend — a line chart across weeks or months
Problems per Period — a stacked bar chart of completed vs attempted
Duration Trend — average session length over time
One technical wrinkle worth noting: Umbraco's System.Text.Json serialiser outputs PascalCase property names by default, but Chart.js data is wired up in JavaScript which expects camelCase. The fix was to use a ?? fallback in JS to handle both casings — e.g. p.Label ?? p.label.
Reading Block List Data
The most technically interesting part of the backend was reading the Block List data back out of Umbraco's published content cache.
Calling .Value<BlockListModel>("problems") gives you a BlockListModel object, but trying to JsonSerializer.Serialize() that object throws a circular reference exception because of Umbraco's internal object graph. Calling .Value<string>("problems") returns the type name string, not the JSON.
The solution was to use GetProperty("problems").GetSourceValue() — this returns the raw JSON string as it is stored in the database, which has a predictable structure:
{
  "contentData": [
    {
      "values": [
        { "alias": "grade",       "value": "Blue" },
        { "alias": "outcome",     "value": "Completed" },
        { "alias": "durationSec", "value": 300 }
      ]
    }
  ]
}
Parsing this with JsonDocument gives clean, reliable access to each problem's data without any circular reference issues.
The Full Picture
Component | Technology |
|---|---|
Watch app | Garmin Connect IQ / Monkey C |
API endpoint | Umbraco 17 API Controller (.NET 10) |
Data storage | Umbraco content nodes (Block List) |
Dashboard | Umbraco Razor views + custom service |
Charts | Chart.js v4.4.1 |
The result is a fully integrated system where I tap a few buttons on my watch at the end of a session, and by the time I've put my shoes on, the data is stored and visible on the dashboard — broken down by grade colour, session, week, month, and year.
There are some parts I want to improve and make better, 90% of the code was Claude and there are things it has done that I maybe wouldn't do myself but for a quick and dirty evening of chatting with Claude, I'm pretty happy with how it's turned out.
Feel free to checkout the dashboard via https://owain.codes/bouldering
a Demo of the app can be seen on Instagram